Goal: Eliminate fatalities and serious injuries on roadways in Oregon.
Every traveler should be able to get to their destination safely. A safe system requires safe people, vehicles, speeds, and roads.
ODOT is responsible for the safety of all users on or along the state highway system. We work to make our system safer in three main ways:
- Engineering: Building and maintaining safe roads, intersections and other infrastructure.
- Education: Teaching all road users how to use our system safely, and how to keep each other safe.
- Partnerships: Working with law enforcement and emergency medical services.
We also manage funding programs like the All-Roads Transportation Safety (ARTS) Program and Safe Routes to School, which support safety investments on ODOT, county, and city roads.
Despite the collective efforts of transportation agencies across Oregon, the state transportation system has become less safe over the last several years.
The number of fatal and serious injury crashes on Oregon’s roads has risen in recent years
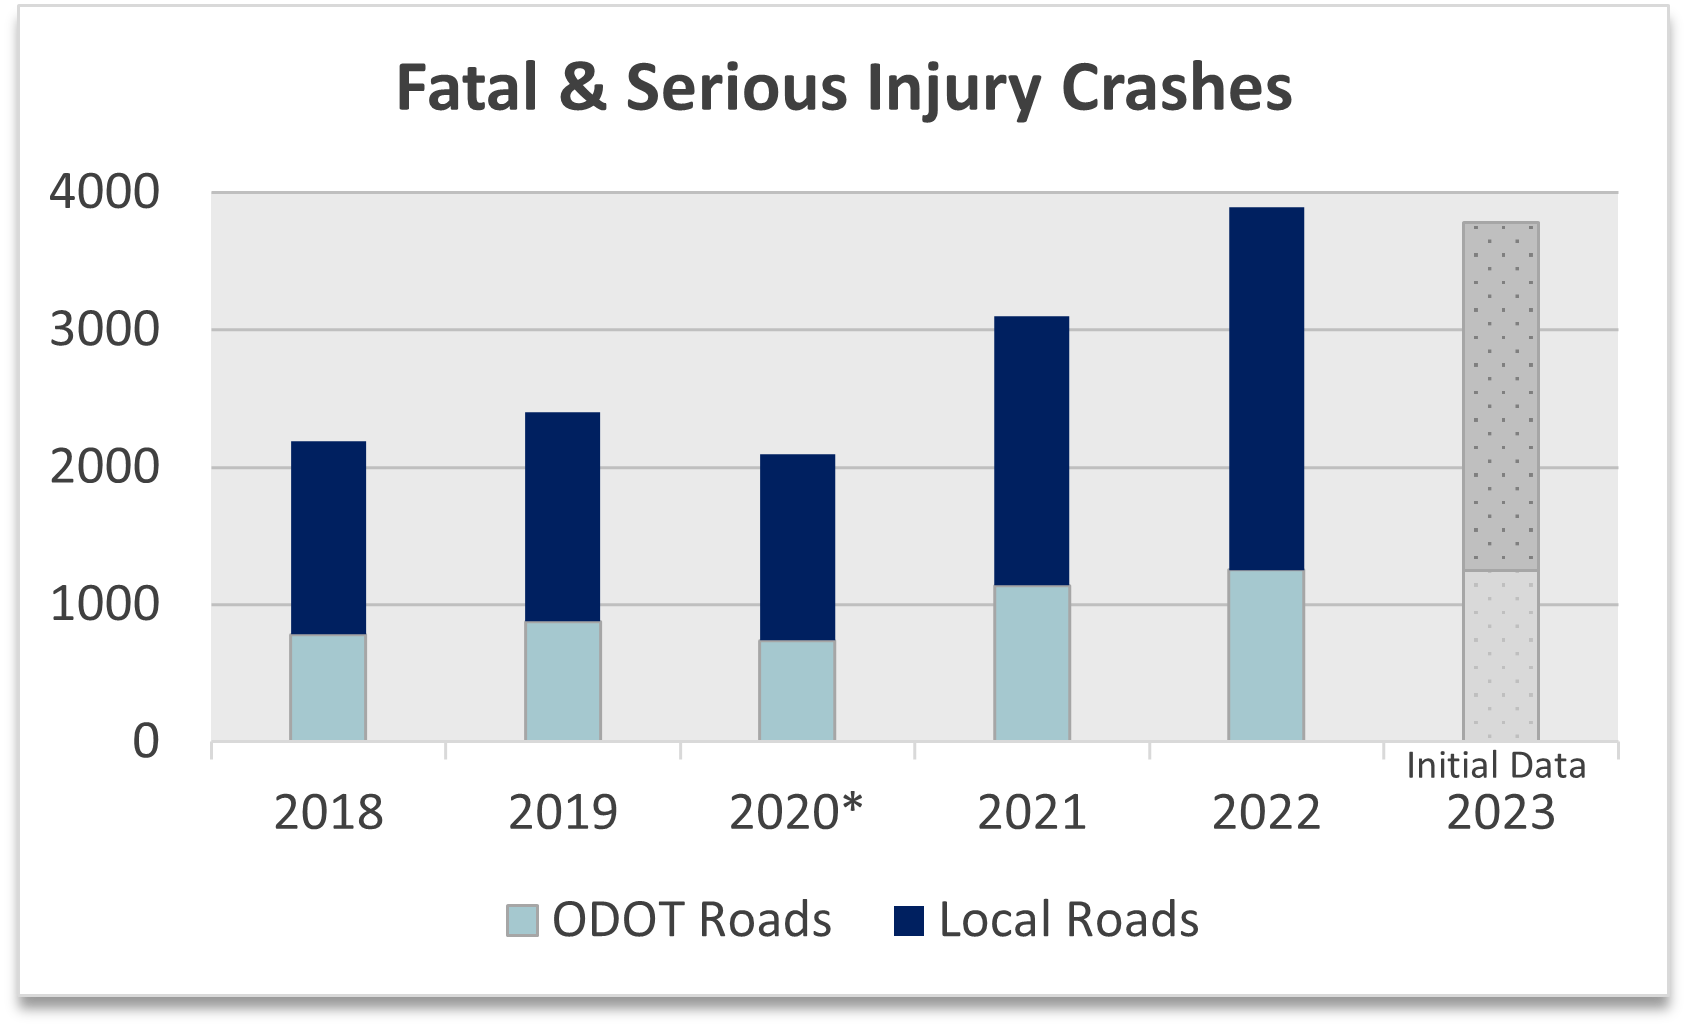
Fatality rates are the highest in three decades
- In 2022, 603 people were killed in crashes.
- 342 on ODOT Roads, 261 on local roads
- Oregon ranked 26th in the U.S. for annual traffic deaths in 2022.
- In 2023, 586 people were killed in crashes.
- 328 on ODOT roads, 258 on local roads.
- Serious injuries from crashes have risen steeply in recent years, particularly on local roads near or at intersections. Vulnerable users like pedestrians, bicyclists and motorcyclists are often involved in these types of crashes.
- Knowing this, we focus investments on improvements like roundabouts and pedestrian crossings.
- Our ARTS program targets the most unsafe roadways statewide, but today's funding level cannot keep pace with these trends. Source: ODOT Crash Data Systems (CDS): Updated 04/2024
Pedestrian safety continues to be a serious issue
- There were 1.5 times more pedestrians killed in 2022 than the previous five-year average (126 deaths vs 80 deaths).
- We have created the Vulnerable Crash Response program to investigate vulnerable user fatalities on state highways.
- We are now able to track these traffic deaths in real-time and report them on our Initial Fatal Crash Information Viewer.
- Our research finds that in Oregon, Black and Indigenous populations are more likely to be killed walking on Oregon’s roads or sidewalks than White people. This is consistent with national trends.
- Recognizing these disparities, we are updating how we identify and select projects to close identified gaps.
Statewide, all
types of crashes have increased
Drivers who are distracted, impaired by drugs or alcohol, or speeding account for most of Oregon's traffic deaths or serious injuries.
Most crashes in urban areas occur at intersections.
- Many involve people who walk or bike.
Most crashes in rural areas occur when a vehicle crosses the centerline or runs off the road.
- We make system wide investments in rumble strips to help reduce these types of crashes, however roads in poor condition can't get this important safety treatment.
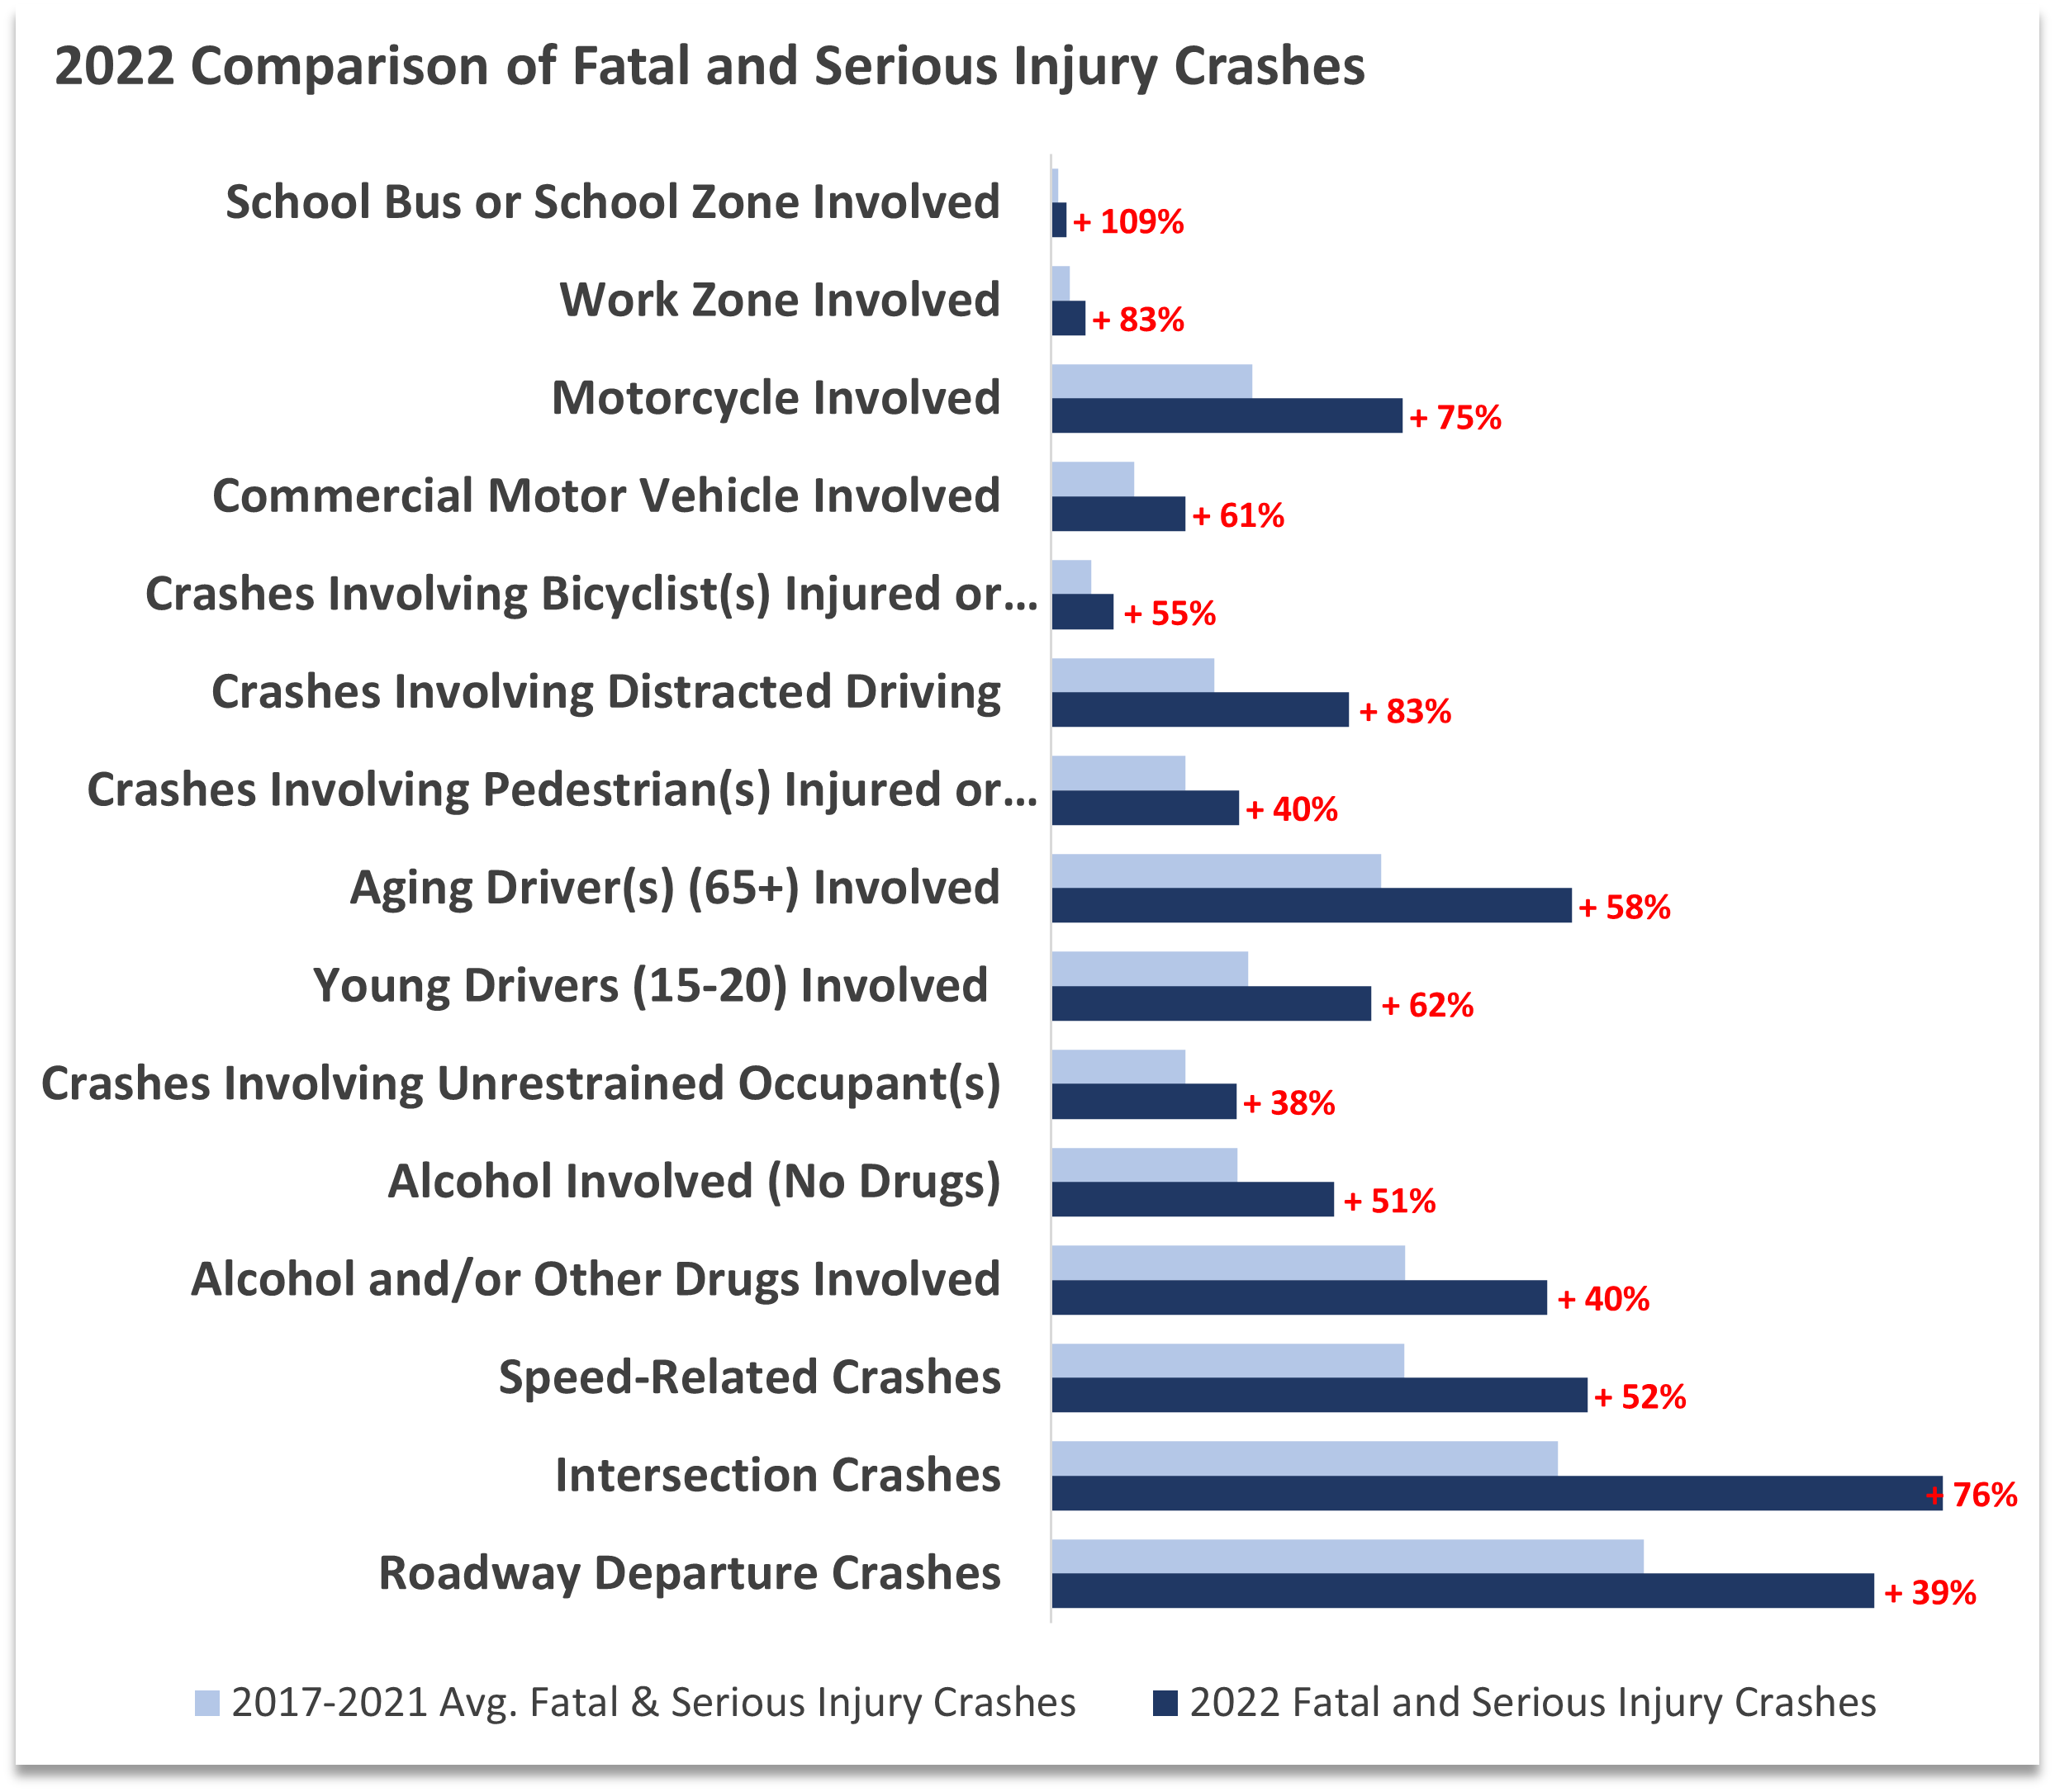 2022 Comparison of Fatal and Serious Injury Crashes chart source: ODOT Crash Data System (CDS)
Work Zone deaths are on the rise
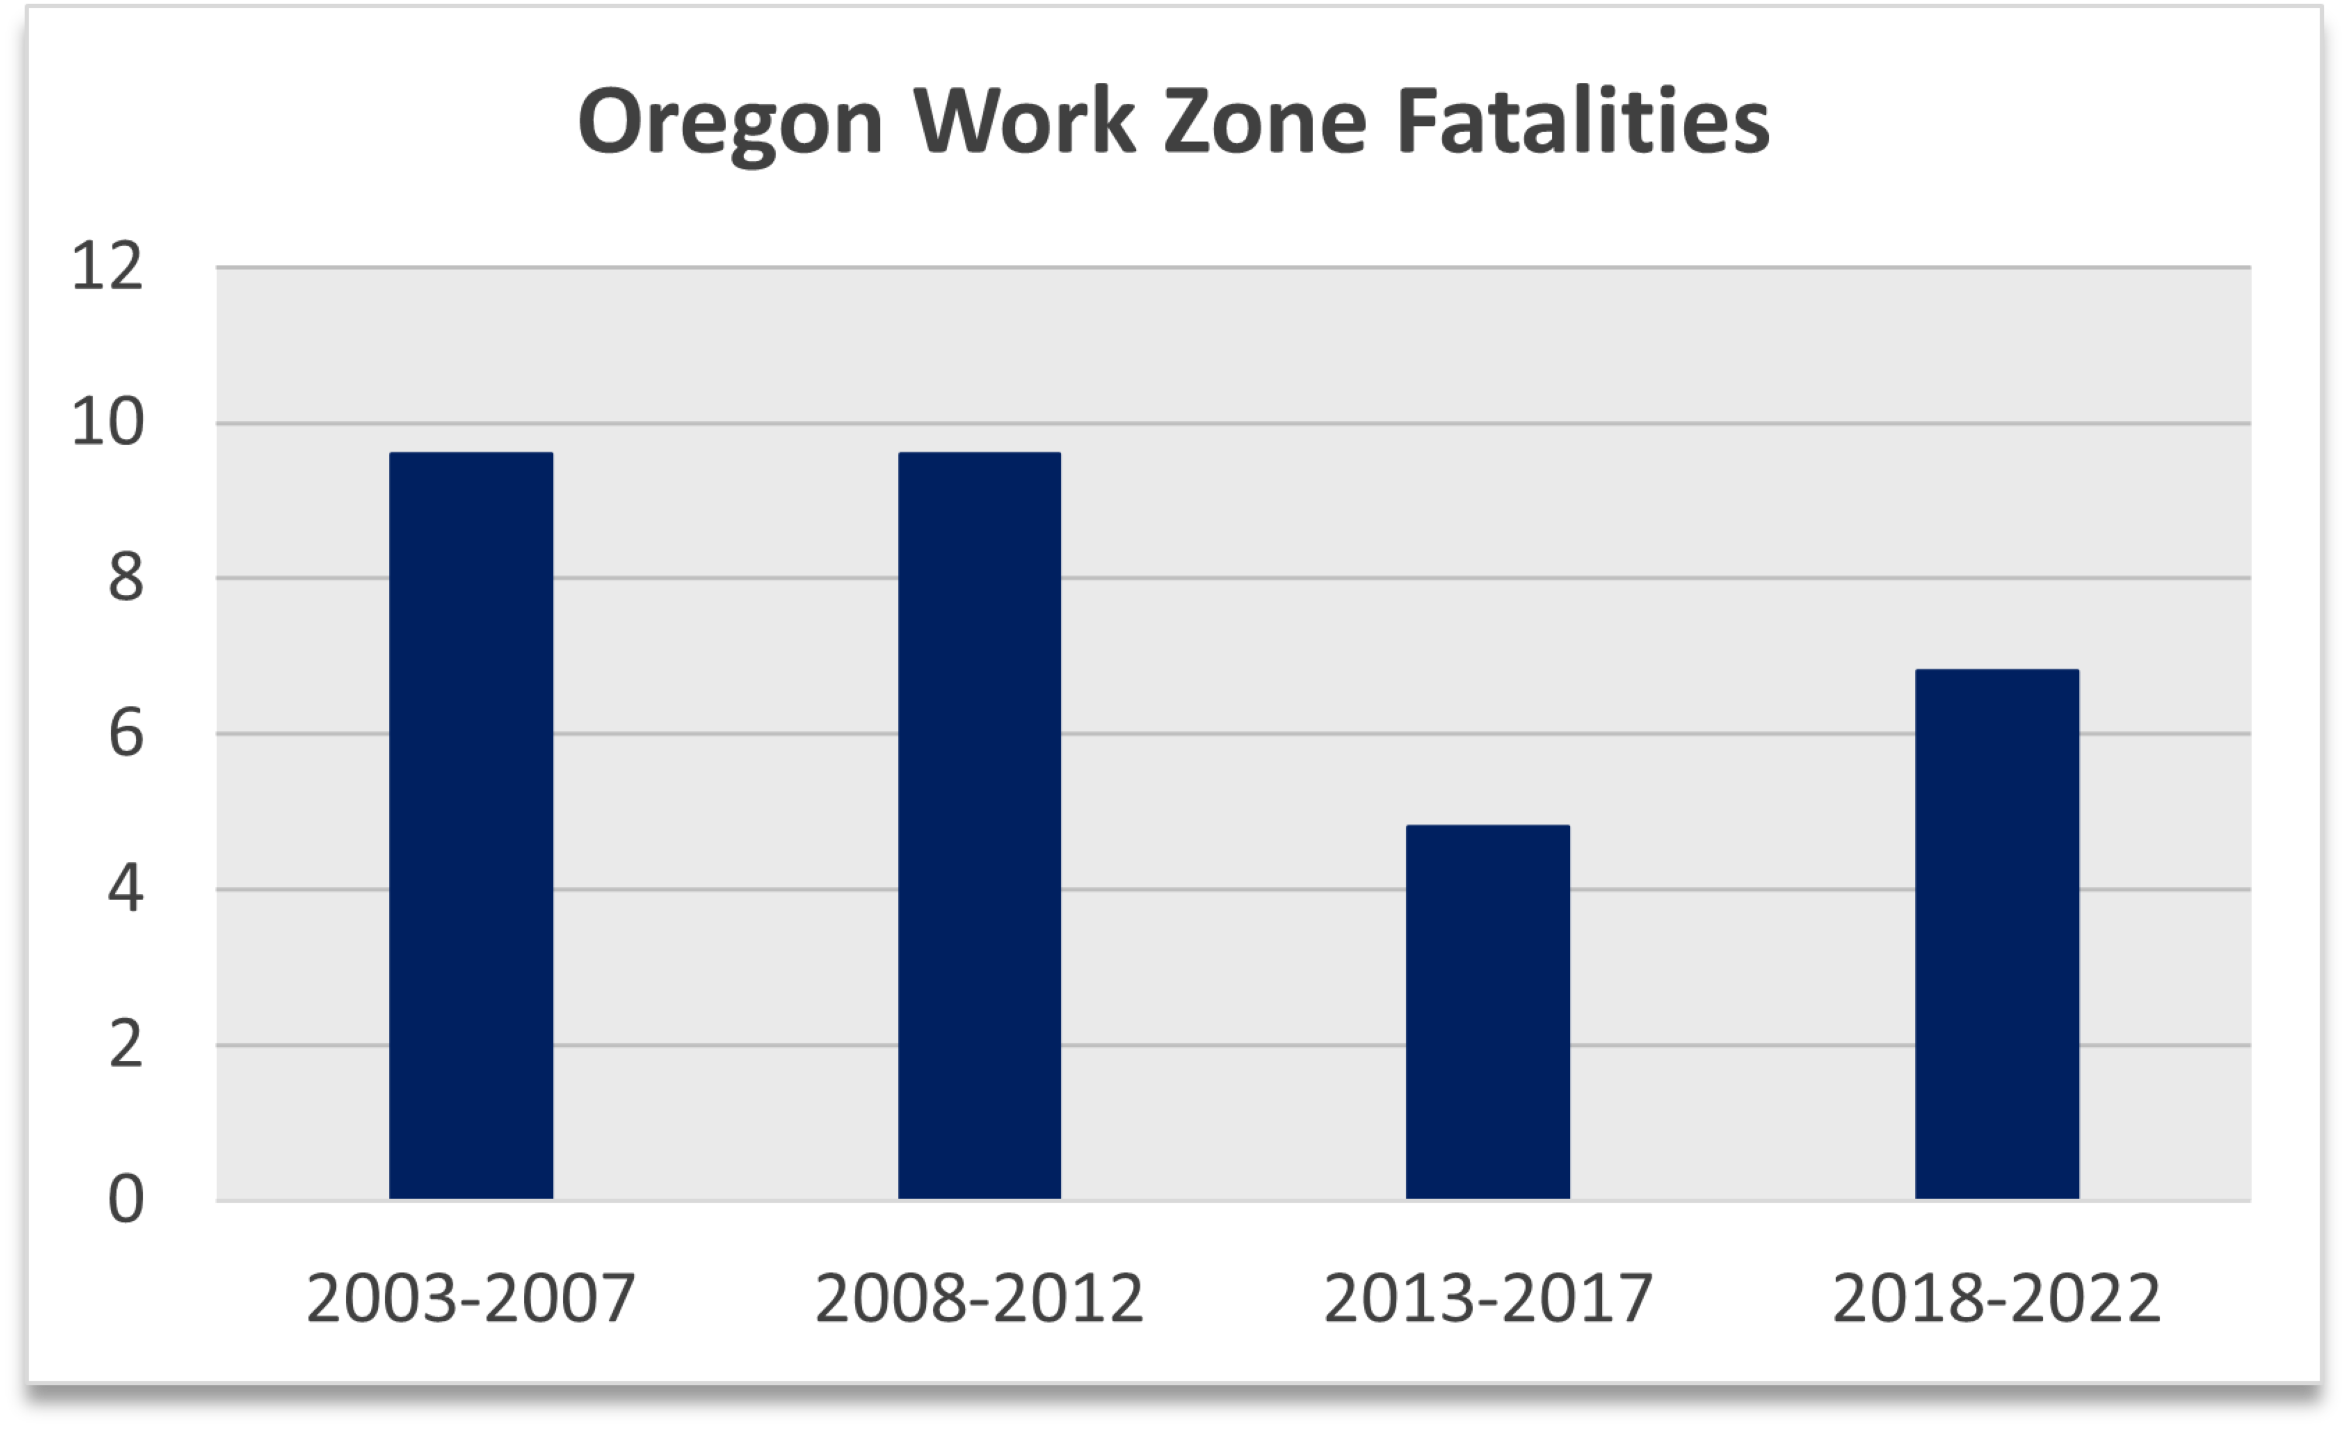
The number of workers killed on Oregon’s roadways has increased in recent years. This is consistent with national trends.
We are exploring automated enforcement and other tools to keep workers safe and reduce work zone fatalities.
Work Zone Fatalities - 5-year averages source: ODOT Crash Data System (CDS)
Updated 04/2024
Screening freight truck drivers and inspecting freight trucks reduce crash rates
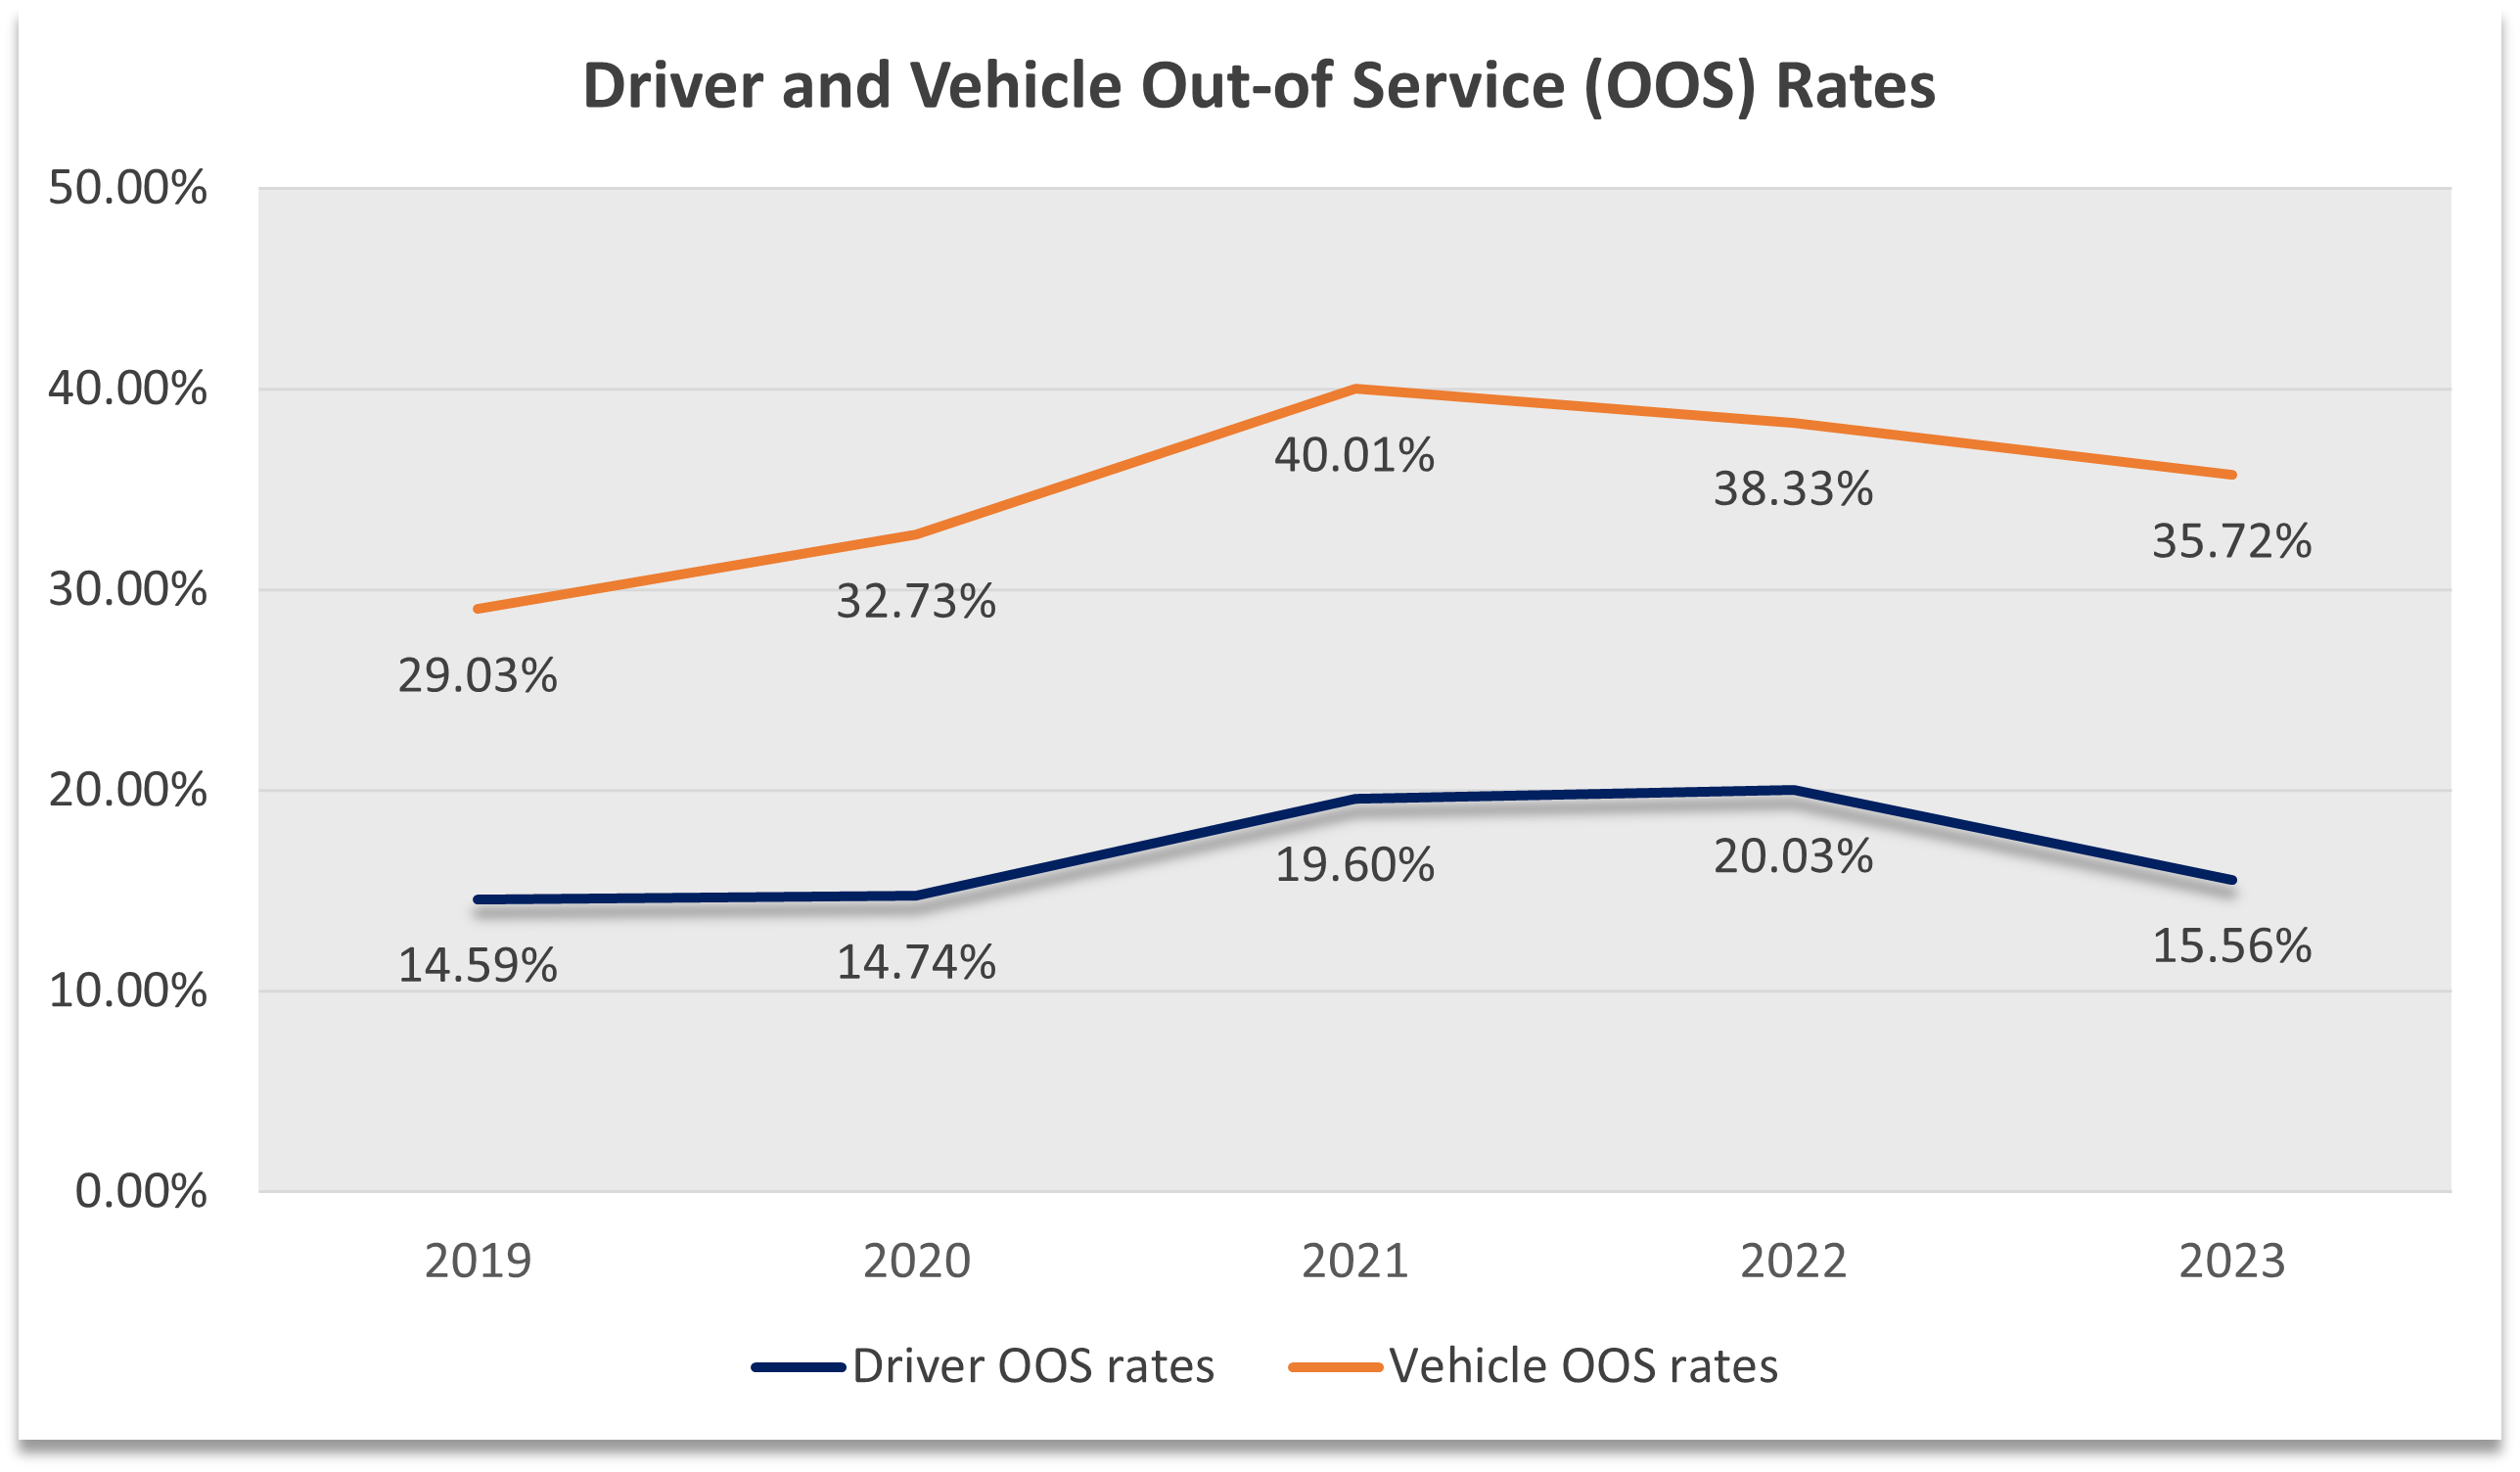
Source: ODOT Commerce & Compliance Division, Updated 04/2024
Wildlife corridors are needed to reduce wildlife-vehicle collisions
- Between 2019 and 2023 there were 27,402 wildlife-vehicle collisions reported, but these numbers are conservative.
- Wildlife corridors can help animals get to where they need to go without crossing roads, which reduces the chances of vehicle-wildlife collisions.
- In 2012 ODOT and our partners constructed the first dedicated wildlife undercrossing at Lava Butte along US 97. After monitoring between 2013 and 2018, cameras detected more that 32 species including black bear, cougar, elk, marmot, racoon, coyote, deer, skunk, rabbit, turkey and bobcat.
- Wildlife-vehicle collisions have been reduced 86 percent along this four mile corridor.
- ODOT and our partners are ready to move on additonal projects to create more wildlife crossings, but currently there is no dedicated funding for that work.
Wildlife-Vehicle Collision History on Oregon Highways 2019-2023
Click on map for more details

Visit our Transportation Safety Office website to learn more