Small projects ($10M or less): 60
- Accurate Timeline Estimations: 40%
- Accurate Budget Estimations: 20%
Small projects include things like culvert repairs, replacing traffic signals, or installing guardrails.
Large projects ($10M-$50M): 14
- Accurate TImeline Estimations: 43%
- Accurate Budget Estimations: 28%
Large projects include things like bridge repair and repaving roads.
To better improve estimates, ODOT is:
- Developing a process for a 10 Year Rolling Investment Strategy to better plan for future investments, including;
- Programming closer to the time the project starts. (1-2 years out)
- Getting further into design (at least 30%) before programming and obtaining a better understanding of permitting and risk mitigation requirements.
- Putting in place more project controls.
- Establishing formalized quarterly project and program reports to identify potential project trends and risk mitigation strategies early.
- Flagging high-cost and high-profile projects at the start and putting in place multiple check-points to help ensure on-time and on-budget performance.
ODOT construction staff manage projects within their allotted budget
Adjustments to project costs and timelines are often made during the development of project bid documents. However, once projects enter the construction phase, we construct and deliver most projects on-time and on-budget. As we improve and align project estimating with project delivery, on-time and on-budget performance should be more accurate from project programming through completion, not just construction through completion.
Construction Projects On-Time
Key Performance Measure
Construction Projects On-Budget Key Performance Measure
We are working to bring this and project estimate performance into better alignment, meaning that overall, on-time and on-budget performance should be much more accurate from project programming through completion, not just project construction through completion.
Investments benefit Disadvantaged Communities
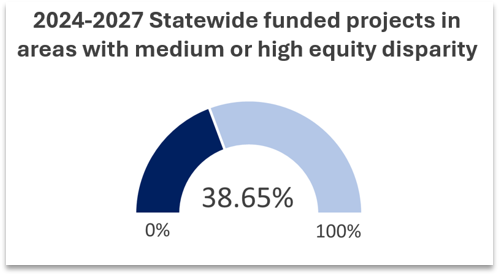
We remain committed to investing funds into regions with low-income populations, communities of color, and areas identified with equity disparities throughout Oregon.
High Equity Disparity areas are places where predictors of social vulnerability overlap to show potential levels of inequity.
Updated 04/2024
We are working to improve our project delivery, but we face significant hurdles
- Many factors impact on-time and on-budget delivery:
- Cost of materials and fuels
- Community support
- Other unforeseen issues (e.g., unanticipated geological features, archeological finds, environmental impacts)
- ODOT plans for average inflation and risks when estimating costs. However, material costs can fluctuate from year to year and even quarter to quarter. Over the past few years:
- Fuel costs have gone up 67%
- Asphalt and cement material costs are up 50%
- The cost of steel has increased by 59%
Source: ODOT Project Controls Office
Updated 04/2024